
Analyzing job market trends with data is the process of using labor market statistics, job posting signals, and analytics tools to evaluate employment demand, skills shifts, and hiring dynamics for smarter career decisions. The labor market intelligence field, sometimes called workforce analytics, gives you a real edge when you know which numbers actually matter. As of april 2026, the US unemployment rate sits at 4.3% with a quits rate of just 2.0%. That combination signals a "low-hire, low-fire" market where competition for open roles is real and preparation separates candidates who land offers from those who wait. Sources like the Bureau of Labor Statistics, LinkedIn Talent Insights, and platforms like Lightcast give you the raw material to read that market clearly.
What data and tools do you need to analyze job market trends?
The right data sources are the foundation of any job market analysis. Without them, you are guessing. The primary data points that matter are job posting volume, unemployment rate, quits rate, time-to-fill, and vacancy-to-unemployment ratios. Each one tells a different part of the story.
Job posting volume, vacancy ratios, and compensation trends together give you a multi-dimensional view of labor market health. Tracking just one metric in isolation leads to bad conclusions. For example, a spike in postings for a role you want might look like opportunity, but if time-to-fill is also rising, it often means employers are struggling to find qualified candidates, not that demand is exploding.

Here is a comparison of the most reliable data sources available to job seekers and career professionals:
| Source | Strengths | Best for |
|---|---|---|
| Bureau of Labor Statistics (BLS) | Free, authoritative, broad coverage | Macro trends, unemployment, sector data |
| LinkedIn Talent Insights | Real-time posting data, skills demand | Role-specific and industry analysis |
| Lightcast (formerly Emsi Burning Glass) | Deep skills taxonomy, geographic data | Skills gap analysis, regional demand |
| Indeed Hiring Lab | Real-time posting trends, monthly reports | Current market pulse, sector shifts |
| Workings.me | AI-powered skills gap analytics | Forecasting skill demand 6–18 months out |
Pro Tip: Match your data source to your career goal. If you are targeting a specific city, use Lightcast for geographic demand data. If you want to track skill trends in tech, LinkedIn Talent Insights and Indeed Hiring Lab publish monthly breakdowns you can act on immediately.
Real-time labor market intelligence tools and APIs, like those offered by Lightcast, let you pull job posting data programmatically. For most professionals, the free public dashboards from BLS and Indeed Hiring Lab are more than enough to build a solid picture. The goal is triangulation, not perfection.
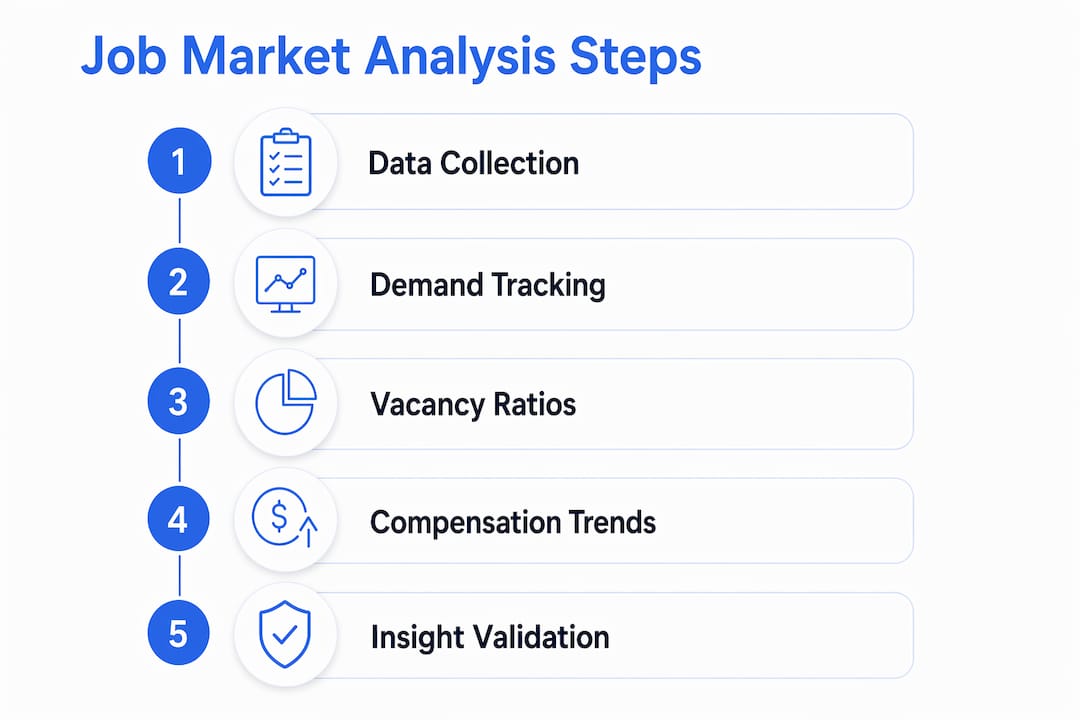
How to analyze job market trends step by step
A structured process beats random research every time. These six steps give you a repeatable method for data-driven job market insights you can act on.
-
Define your critical roles and target industries. Start narrow. Focusing on critical roles that, if left vacant for 90 or more days, create real career or revenue risk gives your analysis purpose. Broad market scanning produces noise. Targeted analysis produces signals.
-
Gather and monitor job posting volume and velocity. Track how many postings exist for your target roles and whether that number is rising or falling week over week. April 2026 total job postings dropped 25.1% month-to-month, landing at 1.9 million. That kind of drop tells you the window for certain roles is tightening fast.
-
Analyze time-to-fill and vacancy-to-unemployment ratios. Time-to-fill and vacancy-to-unemployment ratios reveal market tightness beyond raw posting volume. The average time-to-fill held steady at 47.9 days in april 2026. A long time-to-fill in your target role means employers are struggling to find the right fit, which is your opening.
-
Track skill demand trends and AI impact. Skills requirements shift faster than job titles do. Over 5% of all job postings now mention AI, and 47% of software postings specifically reference AI skills. That tells you where to focus your upskilling before the market prices you out.
-
Use forecasting to anticipate future demand. Real-time signals like job posting velocity and skills demand support 6–18 month forecasting far better than historical data alone. Sophisticated tools use models like Prophet and Random Forests to generate a Skill Emergence Score. You do not need those tools directly. You do need to read the signals they surface in public reports.
-
Cross-reference compensation trends and geographic data. A role in demand in Austin, Texas may pay 30% more than the same role in a smaller market. Compensation data from BLS Occupational Employment Statistics and LinkedIn Salary Insights gives you the full picture before you negotiate or relocate.
| Analytical approach | What it measures | When to use it |
|---|---|---|
| Job posting volume tracking | Demand direction | Monthly monitoring |
| Time-to-fill analysis | Market tightness | Before targeting a role |
| Skill frequency mapping | Emerging skill demand | Quarterly upskilling review |
| Compensation benchmarking | Pay range and geography | Before applying or negotiating |
| Macro indicator review | Economic context | Quarterly strategic planning |
What are the most common errors in job market data analysis?
The biggest mistake professionals make is treating a rise in job postings as proof of growth. Rises in job postings may reflect turnover or poor fill rates, not genuine expansion. If a company posts the same role three times in six months, that is a retention problem, not a hiring surge. You need to read posting patterns alongside time-to-fill data to tell the difference.
Overreliance on historical data is the second major trap. Labor markets shift faster than annual reports capture. The information sector saw its layoff rate double to 2.4% as of april 2026, partly driven by AI displacement. Anyone relying on 2023 or 2024 trend lines for that sector would have missed the signal entirely.
Data coverage bias is a subtler problem. Not every employer posts on every platform. Smaller companies and specialized roles often appear only on niche boards or through direct outreach. If you only track LinkedIn or Indeed, you are seeing a large but incomplete slice of the market.
- Watch for repeated postings of the same role. It signals retention issues, not growth.
- Cross-check any trend with at least two independent sources before acting on it.
- Monitor competitor hiring announcements and macroeconomic indicators as context.
- Treat AI-related layoff data carefully. Job postings for AI-exposed occupations declined more before 2022 than after the ChatGPT release, meaning the slowdown predates the AI wave most people blame.
Pro Tip: Validate every insight with at least two data sources and one qualitative signal, like a hiring manager's LinkedIn post or a company earnings call transcript. Numbers tell you what is happening. Context tells you why.
How to apply job market analysis to your career decisions
Data without application is just trivia. The goal is to translate what you find into concrete moves. Here is how to do that:
- Identify growing sectors that match your skills. Software roles rose 14% year over year as of april 2026. If you have adjacent skills in data, cloud, or AI tooling, that sector is actively hiring and paying well.
- Understand where AI creates risk and where it creates openings. AI is not eliminating jobs uniformly. It is shifting which skills matter inside those jobs. Roles that require judgment, client relationships, and cross-functional coordination are holding steady or growing.
- Use trend data to guide your upskilling. If 47% of software postings mention AI, and you are in tech, adding a credential in machine learning or prompt engineering is not optional anymore. It is table stakes.
- Factor in geography and compensation together. A role with strong demand in a high-cost city may net you less than a remote role with slightly lower demand but no relocation cost. Run the numbers before you commit.
- Use your analysis to time your search. Posting velocity drops in certain months. Knowing when hiring slows in your target sector lets you prepare materials during the quiet period and apply when volume picks back up.
You can build a solid job search workflow around these signals without needing a data science background. The frameworks exist. You just need to apply them consistently.
Key takeaways
Effective job market analysis requires combining real-time data signals, structured analytical steps, and qualitative context to make career decisions that are grounded in evidence, not guesswork.
| Point | Details |
|---|---|
| Use multiple data sources | Triangulate BLS, LinkedIn Talent Insights, and Lightcast to avoid single-source blind spots. |
| Track time-to-fill, not just postings | A steady time-to-fill of 47.9 days signals market tightness that raw posting volume misses. |
| Focus on critical roles first | Targeting roles with the highest career impact sharpens your analysis and reduces noise. |
| Validate AI impact carefully | AI-related hiring shifts predate ChatGPT; do not assume recent data reflects a new trend. |
| Apply findings to specific decisions | Use compensation, geography, and skill demand data together before applying or negotiating. |
My honest take on data-driven career navigation
I have watched a lot of professionals treat job market data like a magic answer machine. They pull one number, draw one conclusion, and make a move they later regret. The data does not work that way.
What I have found actually works is treating labor market signals the way a good investor reads financial statements. No single metric tells the whole story. The unemployment rate at 4.3% looks stable. But pair it with a 25.1% drop in monthly postings and a quits rate of 2.0%, and you see a market where people are staying put because they are nervous, not because they are thriving. That nuance changes how you position yourself.
The future of this field is genuinely exciting. AI-enhanced analytics tools are surfacing skill emergence signals months before they show up in mainstream job boards. Credential verification on the blockchain is making it easier to prove what you know, not just claim it. These shifts reward people who stay curious and keep building their data literacy.
My advice: start simple. Pick two or three data sources. Track them monthly. Build a habit before you build a system. The professionals who read the market clearly are not the ones with the most tools. They are the ones who show up consistently and know what they are looking at.
— Eric
How Earnhire helps you put market data to work
Earnhire is built for professionals who want their job search to mean something beyond sending applications into a void. The platform's AI-powered job analysis tools pull labor market signals directly into your search workflow, so you are not guessing which roles are worth your time. Every resume you tailor and every role you evaluate builds your data worth, the kind of career signal that employers actually use to make hiring decisions. Earnhire's resume tools align your profile with current skill demand, and the guided search experience helps you apply the kind of structured analysis covered in this article. Start your search on Earnhire and turn your effort into measurable professional value.
FAQ
What does it mean to analyze job market trends with data?
Analyzing job market trends with data means using labor market statistics like job posting volume, unemployment rates, time-to-fill, and skill demand signals to evaluate employment opportunities and make informed career decisions. It is the structured alternative to searching by gut feeling.
Which data sources are most reliable for job market analysis?
The Bureau of Labor Statistics, LinkedIn Talent Insights, Lightcast, and Indeed Hiring Lab are the most reliable sources for job market analysis. Using at least two sources together reduces the risk of acting on incomplete or misleading signals.
How does time-to-fill help assess job market conditions?
Time-to-fill measures how long a role stays open before being filled. A steady average of 47.9 days, as seen in april 2026, indicates that employers are finding hiring difficult, which signals genuine demand and gives qualified candidates more negotiating power.
Is AI actually reducing job postings in tech?
The data is more nuanced than the headlines suggest. Job postings for AI-exposed occupations declined more before the 2022 ChatGPT release than after, meaning the slowdown in certain tech roles predates the AI wave most people assume caused it.
How often should I review job market data for my career?
Monthly monitoring of posting volume and skill demand trends is enough for most professionals. A deeper quarterly review of compensation benchmarks and macroeconomic indicators keeps your career strategy current without consuming your schedule.